
People considering a career in political science often have basic questions about their prospective department—questions like, "Where am I likely to end up if I come here?" or "How long am I likely to be here?" or "What are the odds that I will complete my program?" Many graduate programs, surprisingly, either don’t publish that information at all or publish it in disaggregated form as a way of hiding information in plain sight.
Our commitment to transparency begins before students even enroll at our University. Graduate students who are deciding whether or not to choose our program should have the clearest possible answers to these questions. Those answers are below.
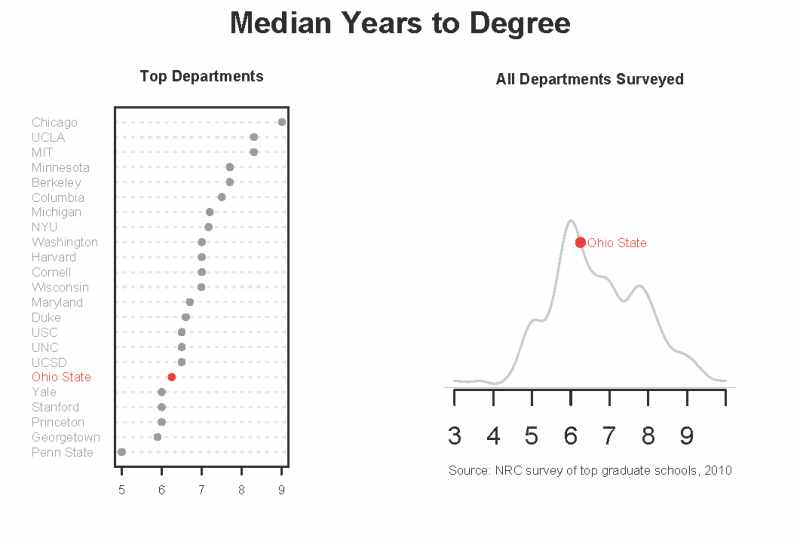
The National Research Council (NRC) cites an average time-to-degree of about 6.5 years in Ph.D. programs in political science. In order to determine where ours fell relative to the national average, we looked at median completion times for all cohorts from 1990 (when the first reliable data exist in our dataset) to 2005 (at which point missing data make the answer unreliable). We also broke the data down by sex of student. The average answer, consistently over time and across the two sexes, generally hovers between six and seven years—a number that corresponds very closely with the national average. It appears that there might be a slight downward trend in recent years, but there are too few students to say definitively whether that is the case.
Median time to Completion
We also broke the same data down by subfield, and here the results are considerably more nuanced. As one often hears, comparativists tend to take longer to complete their dissertations due to the requirements of language classes and fieldwork. Americanists are generally the fastest to complete theirs, and students of International Relations fall somewhere in between. What is most interesting, however, is the fact that, since the late 1990s, time to degree across subfields has converged considerably: the most recent cohorts all show far less variance, completing their degrees in something close to six years regardless of subfield.
Attrition and Completion
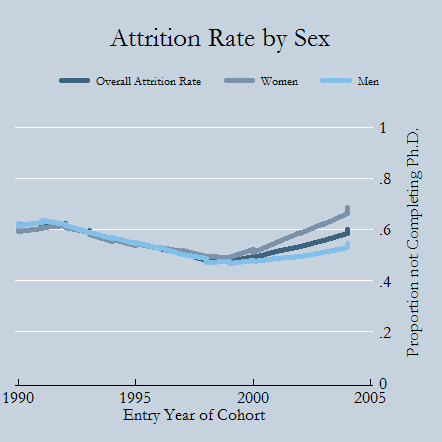 Attrition—whether due to spousal considerations, an attractive career opportunity elsewhere, or personal reasons—is far more common in Ph.D. programs than entering students realize. Many professors tell stories of entering graduate school, being told to look at the students to their left and right, and then being told that only one in three entering students would end up with a Ph.D.
Regardless of the reason, the classical "one in three" statistic is not far off in general for political science programs, nor is it for ours: our actual attrition rate varies widely from one year to the next due to small cohort size, but a smoothed series over time moves roughly between 50% and 60%. (We should note for the sake of comparability that this figure captures all forms of attrition, including simply dropping out and taking a terminal M.A.; in many departments’ official statistics, these figures are disaggregated.)
The Program In Statistics and Methodology (PRISM) provided the research assistance necessary to collect and visualize these data. The Political Research Lab (PRL) created the interactive chart.